Dev & Security

WordPress Debug Mode: 7 Essential Checks for Safe Diagnosis
Your site shows a blank white screen, a “critical error” message, or a feature that suddenly stopped working — with no explanation. WordPress and PHP may record clues, but the message alone does not always establish the root cause. WordPress debug mode reveals them, so you can fix the problem instead of guessing.
This guide explains when to use debug mode, how to enable it safely, how to find and read the debug log, what common errors mean, and how to turn debugging off afterward.
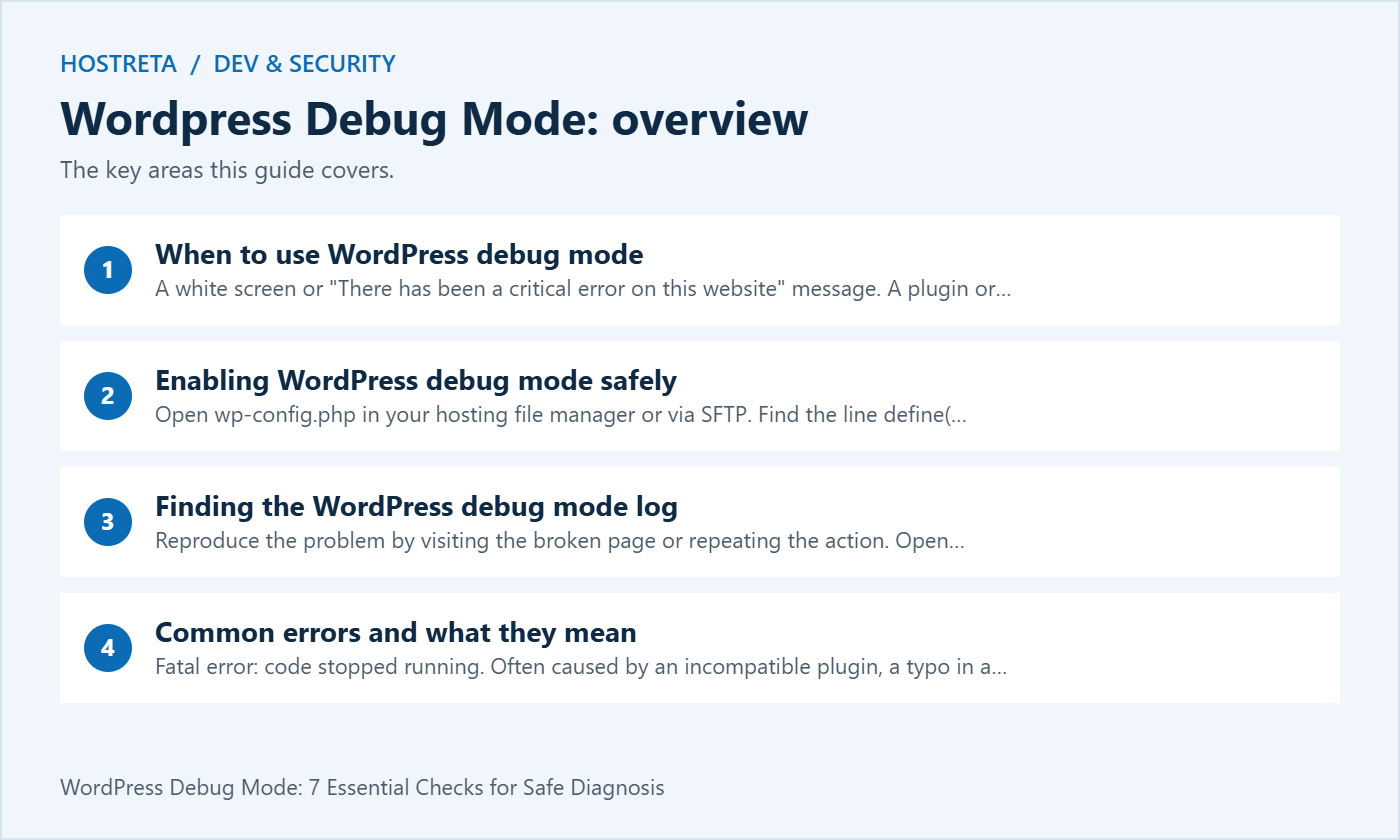
Open wp-config.php in your hosting file manager or via SFTP. Find the line define( 'WP_DEBUG', false ); and replace it with:
define( 'WP_DEBUG', true );
define( 'WP_DEBUG_LOG', true );
define( 'WP_DEBUG_DISPLAY', false );
@ini_set( 'display_errors', 0 );
WP_DEBUG turns on error reporting.WP_DEBUG_LOG saves errors to a file.WP_DEBUG_DISPLAY set to false keeps errors off the screen, to reduce accidental disclosure; protect the log separately and verify the actual response.Always log to a file rather than displaying errors on a live site. Back up wp-config.php before editing it.
wp-content/debug.log in your file manager./wp-content/plugins/some-plugin/.Each line includes a timestamp, the error type, a message, and the file and line number. Redact private information before searching for the message or sharing a relevant excerpt with support.
wp-config.php or contact your host.If a plugin is the culprit and you can’t reach the dashboard, rename its folder via the file manager or use WP-CLI — see WP-CLI for Beginners: Manage WordPress From the Terminal. Server-level errors may also appear in your host’s error logs.
Once the problem is fixed:
WP_DEBUG back to false (or remove the extra lines).debug.log. Left in place, it can grow large and may be publicly reachable, exposing information about your site.Make debugging part of a safe update routine: How to Safely Update WordPress Themes and Plugins.
Monitoring and logging work best alongside layered protection. SiteLock scans for malware, CodeGuard keeps off-site backups with version history, and 360 Monitoring alerts you to downtime. Secure hosting matters too: Kawedma WordPress hosting and managed WordPress hosting powered by Rocket.net include firewalls and automatic updates. Use NordVPN when managing sites over public Wi-Fi.
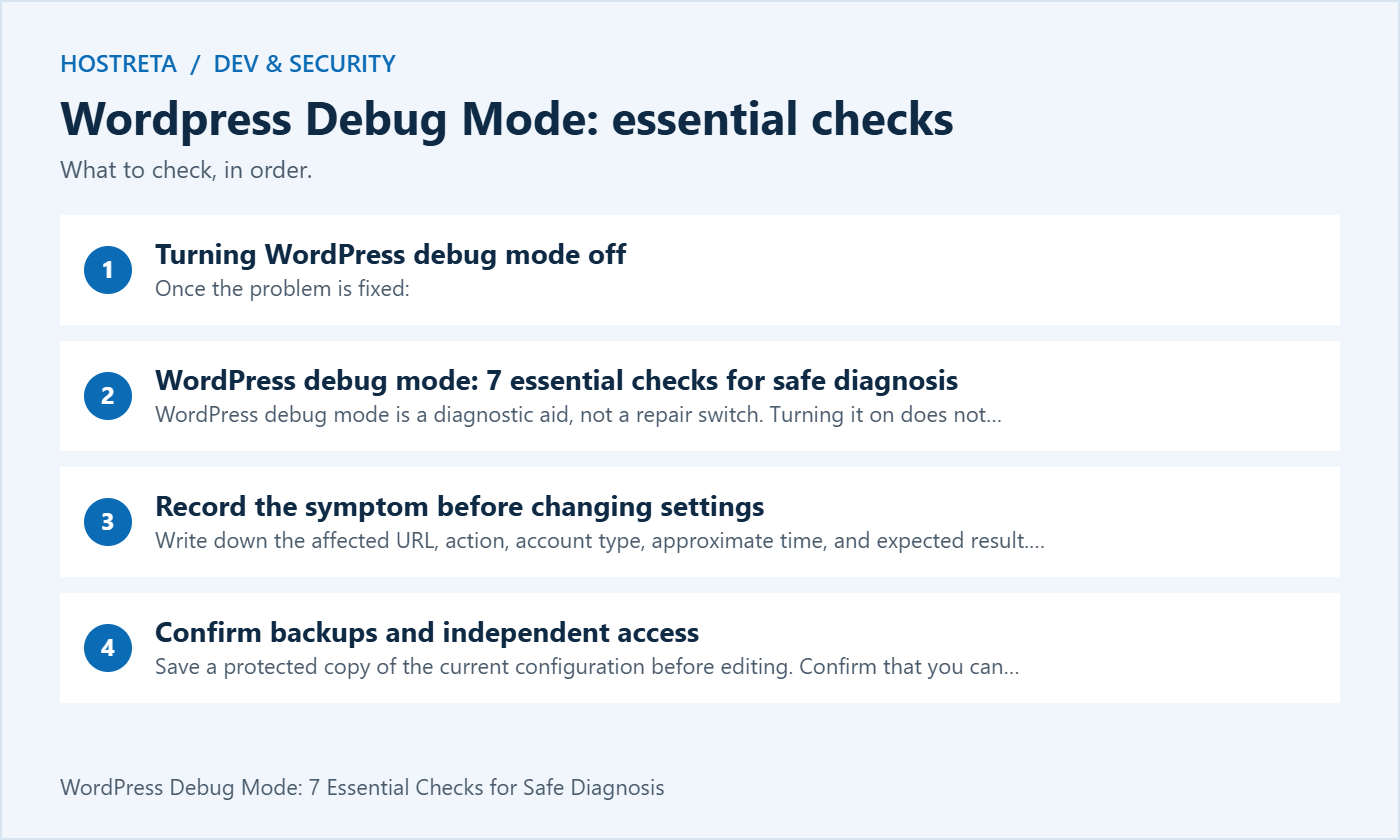
WordPress debug mode is a diagnostic aid, not a repair switch. Turning it on does not resolve the failure and can create additional sensitive records. Prefer a staging copy where you can reproduce the problem without affecting customers. If production observation is unavoidable, agree a short collection window with the person responsible for the website.
The most useful result is a repeatable description of the failure linked to a small, relevant log excerpt. A large unfiltered file often makes diagnosis slower. Work from a clear question, change one condition at a time, and record what the evidence does and does not establish.
Write down the affected URL, action, account type, approximate time, and expected result. Note whether the problem happens for everyone or only for a particular user. WordPress debug mode becomes easier to interpret when you can connect a message to a specific test instead of guessing which of many background requests produced it.
Include recent changes such as a plugin update, theme edit, PHP switch, or hosting migration. These events are useful leads, but timing alone does not prove causation. Keep a short incident timeline so a second person can repeat the investigation without needing a verbal reconstruction of every step.
Save a protected copy of the current configuration before editing. Confirm that you can access the hosting file manager or SFTP even if WordPress stops loading. WordPress debug mode is configured early in the request, so a syntax error in the configuration file can prevent the dashboard from becoming available.
Use a staging copy with representative versions and configuration where possible. Remove or protect production data and disable unintended outgoing messages or payments in that environment. A test copy should let you investigate the relevant behavior without sending real customer emails or creating orders in a live external service.
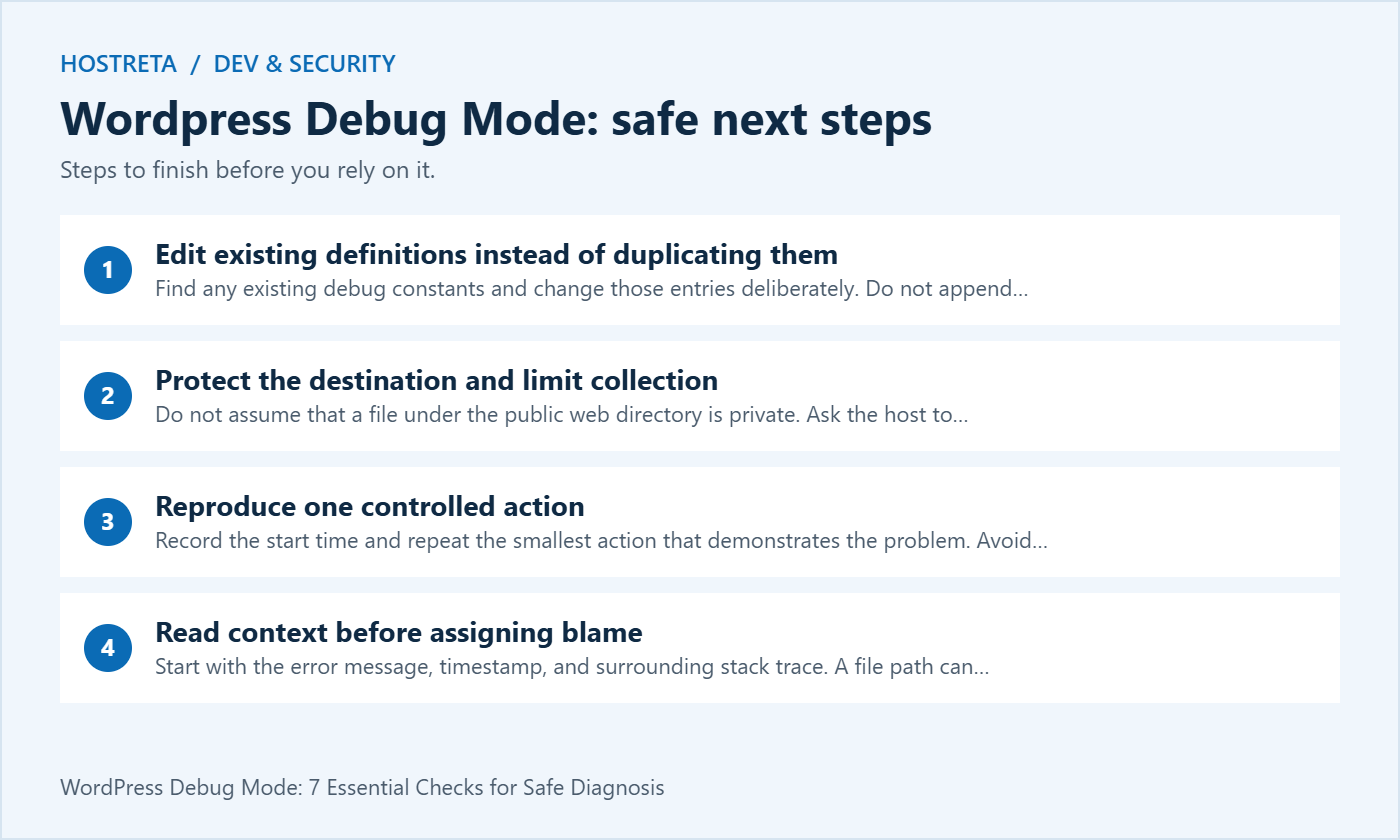
Find any existing debug constants and change those entries deliberately. Do not append conflicting copies to the bottom of the file. Place the configuration before WordPress is loaded, following the official configuration guidance. Use plain code quotes and boolean values such as false, not the string 'false'.
After saving, check that the site and dashboard still load. If the configuration edit itself causes a parse error, restore the saved file through your independent access route. WordPress debug mode cannot provide a normal application log when execution fails before its configuration has been processed successfully.
Do not assume that a file under the public web directory is private. Ask the host to confirm access restrictions or use a supported log path outside the public document root. WordPress debug mode can record paths, request context, and information supplied by plugins, so control access to the file and to any downloaded copy.
Choose a collection window and a person responsible for stopping it. Check storage consumption during that window. A repeated warning can produce a large file quickly, especially on a busy website. Keep only what the investigation needs and follow your organization’s retention rules for any records containing personal information.
Record the start time and repeat the smallest action that demonstrates the problem. Avoid making multiple configuration changes simultaneously. With WordPress debug mode active, compare the new entries against the action you just performed. If the same site also runs scheduled tasks, unrelated messages may appear during your test.
Use an appropriate test account and synthetic data when available. For a form failure, note whether the request was submitted and whether an email or database record was produced. For a page error, distinguish a failure to generate the response from a browser problem that happens after the page has loaded.
Start with the error message, timestamp, and surrounding stack trace. A file path can identify the code that reported a failure, but the trigger may be data or behavior supplied elsewhere. WordPress debug mode provides observations; confirming a cause still requires a reproducible test and a reasoned explanation.
For example, an undefined function can reflect a missing dependency or an incorrect load order. A memory exhaustion message identifies where allocation failed, not necessarily where the excessive workload began. State your working hypothesis plainly, then test it on staging before disabling a major component or changing host limits.
After applying a targeted correction, repeat the original action and inspect the user-visible result as well as fresh logs. WordPress debug mode should help confirm whether the relevant failure recurs. A silent log is not enough if the form still fails to submit or the checkout still produces an incorrect result.
Return diagnostic settings to their intended normal state and remove temporary instrumentation. Handle collected files securely, check that the public site does not expose diagnostic output, and record the fix. Include a brief prevention note, such as an update test or dependency check, when it addresses the actual cause.
| Tool or observation | Useful for | Important limit |
|---|---|---|
| WordPress debug mode and PHP log | PHP messages generated during application execution | Does not explain every browser or infrastructure failure |
| Browser console and network panel | JavaScript exceptions, failed requests, and response details | A browser message may reflect a server-side cause |
| Hosting error logs | Server and PHP startup or request failures | Availability and location depend on hosting configuration |
| Application acceptance test | Whether the original user task now succeeds | A successful sample does not cover every possible path |
Choose the tool based on the symptom rather than enabling every diagnostic option. WordPress debug mode is useful for PHP investigation, while a missing image might be an incorrect URL or access rule. A request that never reaches PHP may require the host’s infrastructure evidence instead of changes to WordPress.
Preserve the order of related entries and identify the relevant time zone. Note whether timestamps come from the application, PHP, or the hosting panel. WordPress debug mode output can be mixed with messages from plugins that format their own records, so do not assume every line follows the same structure.
Separate repeated symptoms from the first actionable failure in the request. A later message about missing data may follow an earlier exception that prevented that data from being created. Keep enough context to understand the sequence, but avoid pasting a whole day of unrelated activity into a support ticket.
A useful private incident note might say: “At the recorded time, a test editor submitted the settings form. The request failed, a matching exception appeared, and the setting remained unchanged.” This connects evidence to behavior without prematurely asserting that the first plugin named in the trace caused the underlying defect.
First confirm that you are inspecting the correct WordPress installation and configured destination. A staging and production site may have similar directory names. WordPress debug mode must be enabled for its companion logging setting to take effect, and the PHP process needs permission to write to the chosen location.
Next reproduce a relevant action. The absence of a file does not prove that logging is broken; the tested request may not have generated a message. Do not deliberately introduce a failure into production just to create a log entry. Use a controlled staging test or ask your developer to verify the logging configuration.
If the request fails before WordPress loads, inspect the appropriate hosting or PHP error log. If the visible failure occurs only in JavaScript, look at the browser console and failed network request. WordPress debug mode cannot record an exception thrown solely inside the visitor’s browser.
Use staging to isolate changes while keeping a copy of the original configuration. Record active plugin and theme versions before testing. If a suspected component can be disabled safely in that environment, repeat the exact failing action with and without it. Restore the starting state before moving to another hypothesis.
A change in behavior narrows the investigation, but interactions can matter. Two independently working plugins may conflict when both attach behavior to the same workflow. WordPress debug mode can provide additional evidence during those comparisons. Keep the test matrix small enough that you can explain which condition changed for each result.
Avoid editing vendor files as a quick permanent fix. Updates can overwrite those changes, and the edit can make later support harder. Prefer a supported update, a documented configuration change, or a maintained customization reviewed by someone who understands the affected code path.
Review excerpts before sharing them outside the team. Remove passwords, tokens, session identifiers, customer details, and private URLs where appropriate. Preserve useful structure such as the error class, component version, and a sanitized path. WordPress debug mode logs should not become an accidental public archive of operational details.
Do not ask a customer to send payment card information as part of reproducing a checkout issue. Use the payment provider’s supported test environment and synthetic records. Keep diagnostic attachments in an approved private channel, and limit access to the people who need them for the incident.
After the issue is resolved, review where copies were stored: local downloads, ticket attachments, shared folders, and the host. Apply the relevant retention process to each copy. Removing the original file from the server does not remove a copy already shared elsewhere.
Contact the host when the evidence points to PHP configuration, process limits, storage, access rules, or errors before the application starts. Provide the affected domain, exact time window, and sanitized message. Ask which server log covers the request rather than assuming every failure belongs in the WordPress application log.
Contact the responsible developer when you have a reproducible code-level error or a conflict that requires reviewing hooks, inputs, or dependencies. Provide the steps, expected behavior, versions, recent changes, and relevant excerpt. WordPress debug mode is most valuable when it turns a vague report into that concrete set of observations.
If you need implementation help, KAWEDMA offers hosting and website development services. Describe the symptom and the available evidence before commissioning changes. Agree what a successful test looks like and ask for a short handover explaining the correction and recovery route.
Prefer targeted use in local development or staging. Permanent verbose collection can add overhead, fill storage, and retain unnecessary information. If production monitoring is required, use a planned logging setup with controlled access, rotation, and retention rather than leaving an ad hoc troubleshooting session running indefinitely.
No. Assess the consequence of the message. A warning may accompany a broken API response, incorrect output, or a failed operation even when the page still renders. WordPress debug mode makes the message visible to the investigator; deciding urgency requires checking the affected behavior and data.
It may provide temporary headroom if the host permits it, but it does not establish why the workload consumed memory. Check the effective server limit and the failing operation. An inefficient loop or unexpectedly large dataset can exhaust a higher limit too, so verify the cause and measure the result.
No. Its documented purpose concerns development versions of WordPress core scripts and styles; it is not a general repair for third-party JavaScript. Use the browser’s diagnostic tools and the relevant component documentation. Enable additional tools only when they address a specific question in the investigation.
Record the symptom, reproduction steps, evidence, confirmed cause where known, correction, acceptance result, and cleanup. Note any remaining uncertainty. WordPress debug mode should be disabled or returned to the planned baseline, and temporary log files should be handled according to the agreed retention process.
We may earn a commission on purchases made through these links, at no extra cost to you.
Don’t miss the chance to participate in the biggest giveaway of this year.